I’m trying to use Google Sheets for journaling purpose and it works awesome. Journaling helps me to reflect on my experience in a more objective manner and to provide helpful insights. Sometimes memory is not reliable and biased reflection can leads me astray. Besides, having a personal stats about yourself is really cool, right?
I know not all people are this obsessed with Google Sheets nor numbers. But I’m just sharing you of how awesome it could be to have a reliable measurement of your past experience that you can utilize one day. Understanding insights after a handful amount of data collection could help as us, a human being can be forgetful and biased. Ending this year, I am going to understand how I passed this chaotic 2020 with the journalling I have in Google Sheets.
Journalling is easier with prompts, in which I put in a Google Forms so I can have same prompts daily and weekly and conclude all these prompts as variables at the end of the period. The daily prompts consist of what I feel during the day, what I learned, and what to learn next. Among those 3, I can get quantitative and qualitative insights. As emotions are put into multiple-choice question, it will go under quantitative analysis. But for the other two, I will analyze them in a qualitative manner to find the themes and understanding the why under those numbers from emotions I feel.
Right now, the first take I have is the quantitative insights, since it’s easier. Let’s start from the daily prompts.
First thing first, let’s start to cut the big chunk of it (a.k.a. descriptive stats):
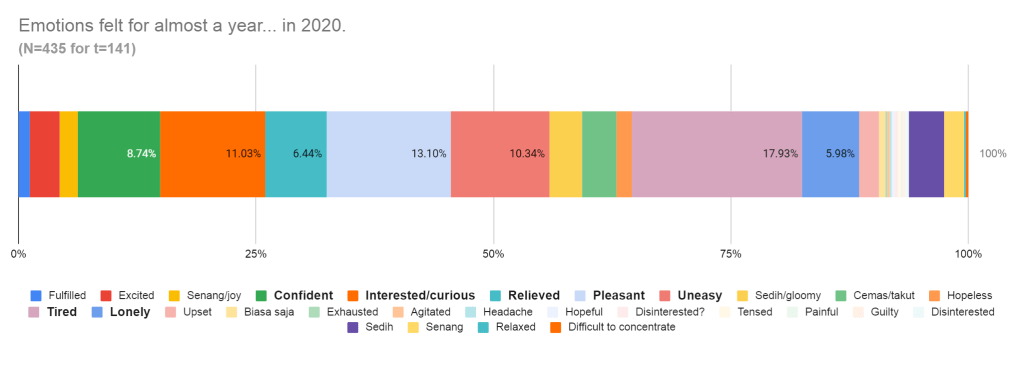
Wogh. Top emotions that I felt, in order:
- Tired (17.93%)
- Pleasant (13.10%)
- Interested/curious (11.03%)
- Uneasy (10.34%)
- Confident (8.74%)
- Relieved (6.44%)
- Lonely (5.98%)
I’m not going to the bottom, 5% is the limit to consider them as major for me.
There are lots of dusty purple, which indicates “tired.” So I can conclude that I am correct to post this a while ago on Twitter:
If you pay attention, I differentiate between negative and positive emotions, in which negative ones are in italic. Let’s calculate how much is the proportion between positive and negative:
Proportions of positive/negative = sum(positive emotions) / sum(negative emotions)
= (13.10% + 11.03% + 8.74% + 6.44%) / (17.93% + 10.34% + 5.98%)
= 39.31% / 34.25%
= 1.15
Wow! I experienced more positive emotions, specifically 1.15x more than negative ones. (insert “wow” noise sfx from Youtube).
So… 2020 was not as bad as it seems, eh. Nice. I’m starting to like this, having my assumptions broken by data. Feels satisfying.
Now let’s get into the details, as the saying goes “the devil is in the detail.” 😈 I try to count how I feel emotions daily and create a timeline chart. Oh and a limitation here, I started the daily journalling in April, so it’s not exactly 12 months, but that’s enough data, I think.
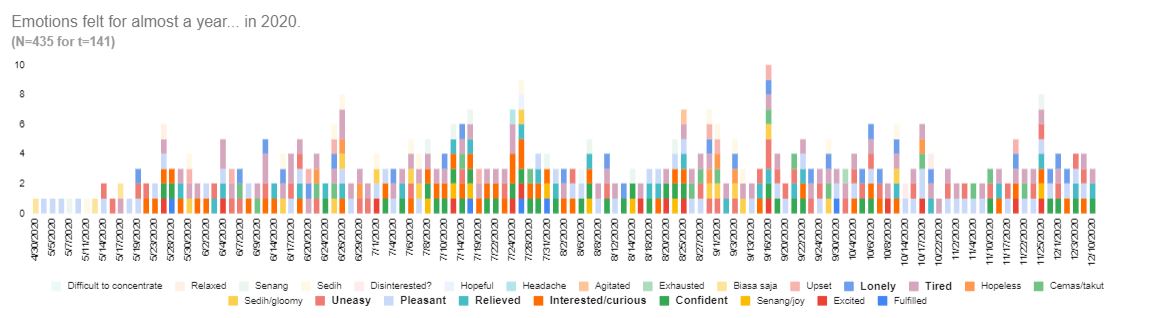
Hmm.. it’s still difficult to derive insights by presenting it that way. Too specific. Let’s change it into a monthly basis:
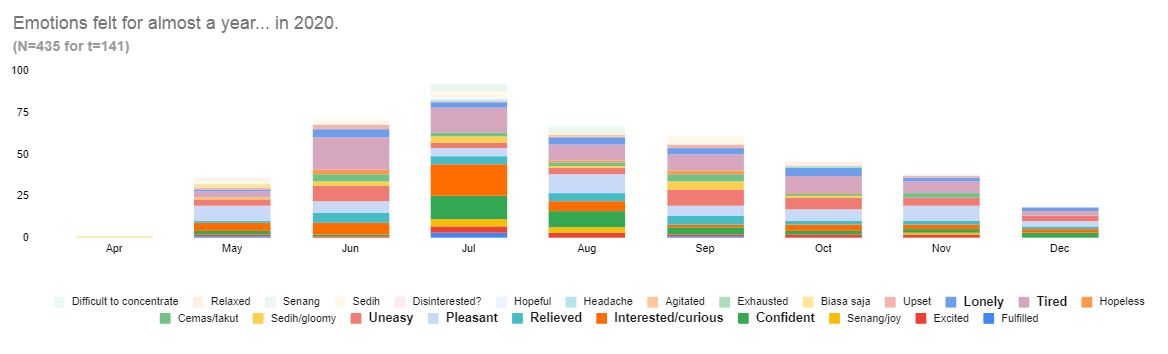
Ah. Clearer view! Now I can find which emotion I felt the most in specific month. Hello there, majority dusty purple! Oh, there’s also you, bright orange in July! Hmm. But looking at the # of emotions in each month, it looks like I was not consistent enough across the months to fill this daily prompts. (We will discuss about my lack of discipline later at the end).
Ok, so to not get a misleading monthly conclusion, let’s convert the chart into a 100% chart.
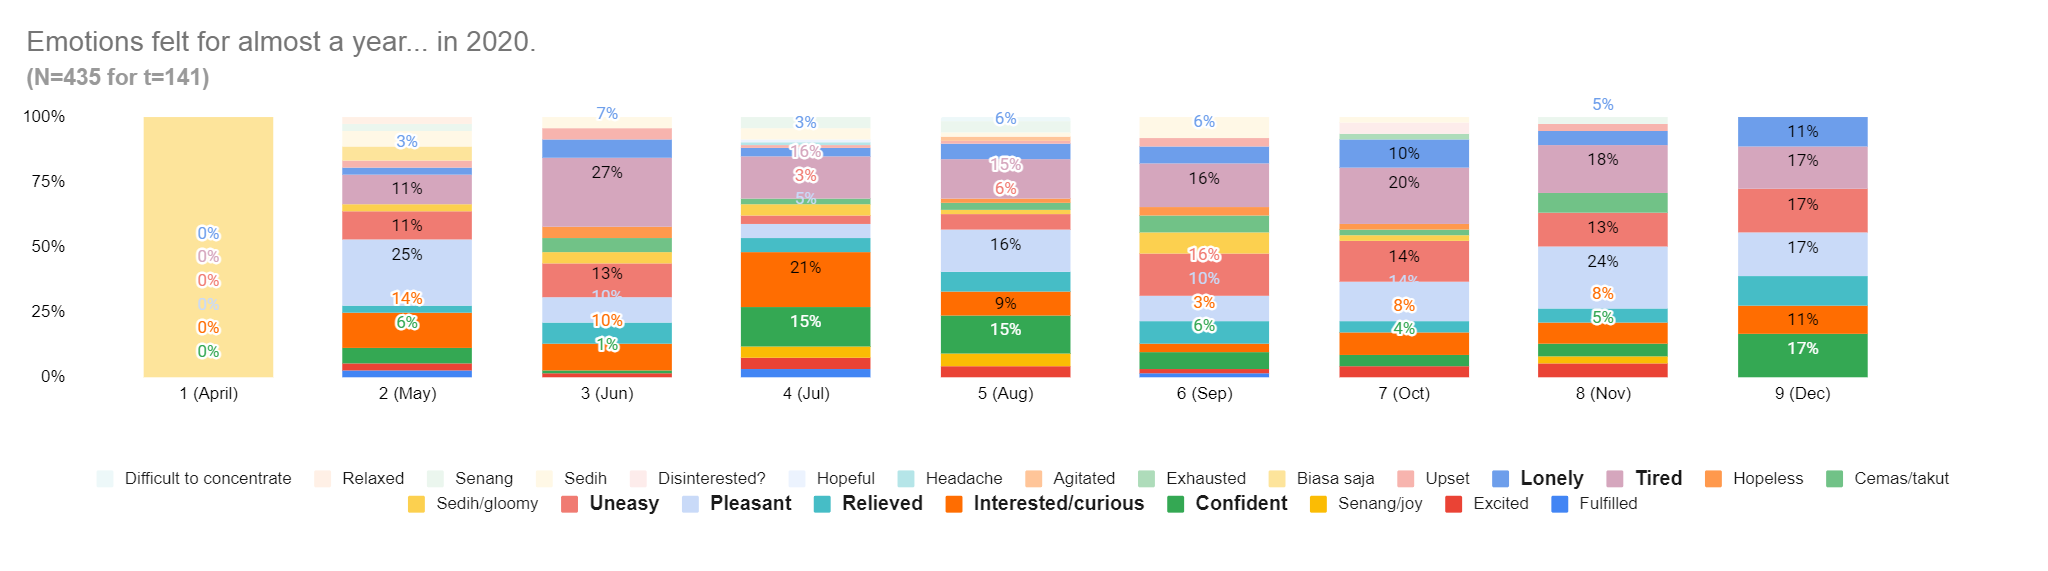
Now we’re actually seeing that I did not fill much of the entries in April so let’s ignore that month.
Let’s see, most of the month consists of mostly “Tired”, except in May and November, where its top one is “Pleasant”. And also exception in July where I was mostly “Interested/curious.” Interesting.
Okay. It is still difficult to grasp. So let’s change it again into Positive, Negative, and Neutral emotions. Basically grouping the emotions according to its valence (e.g. “Tired” is Negative while “Biasa aja” is Neutral, and “Interested/curious” is Positive.)
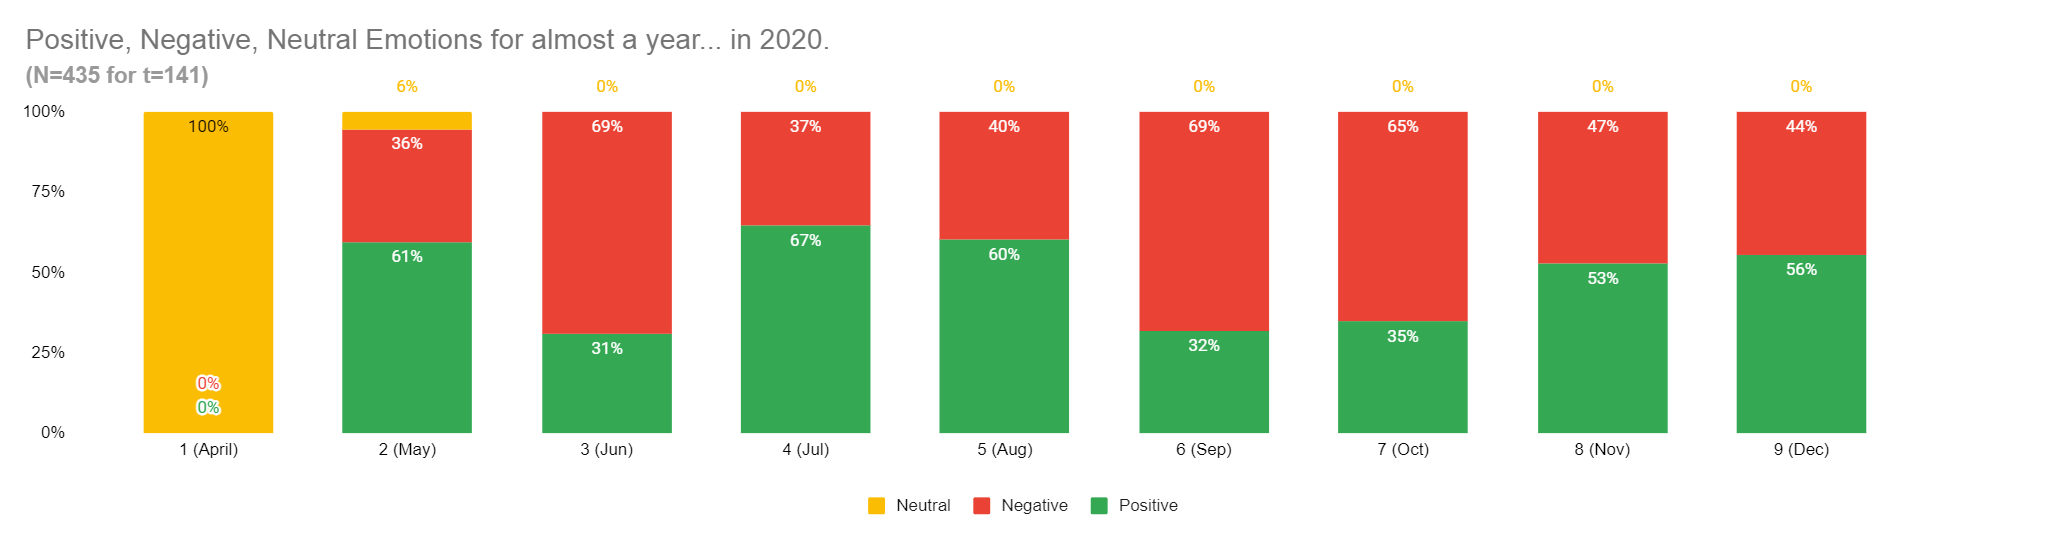
I am looking at you Jun, Sep, and Oct. Why were you so negative?
And what happened in those positive months? Can I replicate those experiences so my life is less gloomy?
May was the month where I transitioned into handling more job descriptions. I am a researcher in a startup, so… due to the demands I held more requests and one-manning the whole endeavors. It was exciting at first, but it became clear in June that the pleasantness has turned into major tiredness.
In the middle of June I got help by getting another teammate (a friend) and an intern. So look at that! July was an interesting phase for me until August 🙂
Then September was a trainwreck. I got shingles due to stress I guess. Shingles really hurts, man. It’s the more advanced chickenpox that got resurrected when you’re immunocompromised. So it’s either you’re old, have an auto-immune disease, or stressing out so your immune cannot work well (source). I fulfilled the last criterion only LOL.
Oh and don’t forget, life still has its own surprise. My teammate passed away suddenly and I could not function normally. Ah. What the hell.
I think the grief carries on, even until now. Besides, I haven’t gotten any replacement for a teammate, except in November I got an intern to help. Hence things are looking more positive in Nov and Dec! (A little celebration won’t hurt, right?)
Okay. Now adding some spices from qualitative insights I derived from my daily entries. I actually have compiled some findings along the way before writing this. And some insights are:
- I often skip writing daily journals when my emotions are not that intense.
- I get my energy recharged when my routine is good, learning new things, working on things I like, and making arts.
- On the other hand, I get my energy drained when having problem at work (mostly about uncertainties and heavy context-changing). That’s it. My main stressor is work :’)
Since daily journalling mainly focus on in-the-moment emotions that are specific, let’s jump to the other type of journaling—the weekly one. This is where I rate the whole week according to 3 aspects: self, work, and friendship. It is not as specific as the daily one. And this is intended to see which factor contributes the most to how I feel during the week.
This is how the weekly prompts look like:
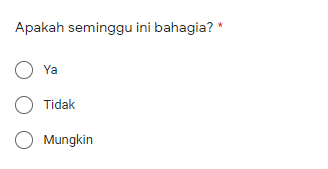
Firstly, I rate if I was happy for that week by selecting one of three choice: Yes, No, Maybe.
Look at how I frame the wording. HAHA. I use a positively-inclined leading question in order to nudge my answer to be a bit more positive. I cannot just use a neutral tone as my mind is already inclined to a more negative tone, honestly. Was I successful in tricking my mind?
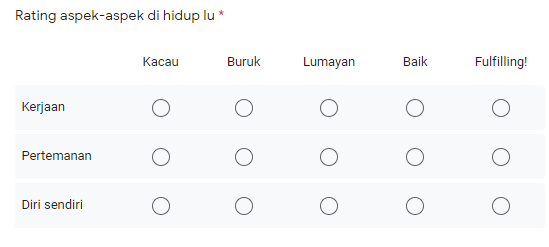
Next, I rate how I feel towards these 3 aspects from Worst (Kacau) to Best (Fulfilling) on a 5 Likert-scale. Somehow I’ve never indicated that it was the worst week ever. I think negative intense emotion cancels out by a slightly positive one in the whole week.
Life is a picture, but you live in a pixel. Inspired by Waitbutwhy, so here is my life in weeks, with some tweaks:
Visually, we can see how the Overall week color corresponds the most with Work. Is that really true? Okay, I have the itch to open SPSS now to calculate the correlation between these variables.
Nah, no need. Google Sheets is reliable, let’s calculate correlation* there instead.
*I know, it’s not the ideal since this is a within-subject data and Sheets is only able to do Pearson’s. According to the decision tree on Andy Field’s book, we should use Factorial Repeated ANOVA: categorical output and predictor with >1 predictors, and same participants in the predictors (only me!). But nah man, this is just for fun and the data collection was not really rigorous anyway. Besides, I want to show-off how powerful Sheets is LOL, so let’s get into it.
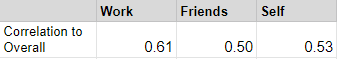
I just calculated the correlations** for those three aspects to Overall, rounded to two decimals, and got that. Of course by first converting those choices into number (e.g. “Fulfilling!” is 4, “Kacau” is 0, and so on). Below is the function I use, a Pearson Correlation in Google Sheets. Just type =CORREL and put your Y variable and X variable as follow:

**CAUTION: This is NOT how you actually compare correlations of different predictors. By calculating it this way, it can inflate the Type I error rate (I despise how academics name things, it simply means you’re probably discovering positive result where there’s not any). Again, this has a very low academic credibility, but sufficient enough to convince business user. Y’know, sometimes the more complex the method that you use, the harder it is for them to rationalize the insight themselves and the less reliable you are perceived. Somehow just a simple common sense works better than complicated but rigorous calculations, talking from my experience. Most of the time, descriptive stats are enough. Did I just rant? (insert sad violin noises)
So in conclusion, the correlation coefficient for Work with Overall is the highest compared to Self and Friends. Put it differently, Work is the main contributor on how I rate the overall week . When work is good, life’s good for the week, when it’s not, life will not be bad. And the least contributor is Friends. As someone with smaller need for affiliation (McClelland’s theory), and bigger need for achievement, that conclusion makes sense.
Okay. So there’s absolutely something to be looked at the work section. What makes it bad? But you indicated that work also gets you recharged. So what’s the conclusion? I think it’s time to resign1look for things I can improve at my work situation. Maybe by getting more structured in my approach or something else. I won’t discuss it further here.
So what’s the take? Does the benefit of this data outweigh the effort?
If you are a business that is looking for a measurable capital gain, it does not. It’s too tedious to ask your employee to do this mundane reflection. If you are me with a nerdiness towards research and using Google Sheets, it is worth it. I learned important things from this exercise.
Here are what I learned:
- Having more accountability for myself
- Appreciating life more, moment by moment
- Getting more resilient by learning
From this journalling, I practiced to be accountable about how I feel. I used to blame myself for not understanding why and how my mood changes a lot. Understanding and validating emotion are important before we are able to fix it. It’s like in that Harry Potter scene where you can name your fear, the fear can get away. I think it goes also to negative emotion—once we name it properly, it gets easier to resolve it.
Secondly, I also get to appreciate how my life went during this 2020. As I keep a tangible record on how it was, I feel like having a sense of achievement that I went through that shit and still be able to be here. It also gives the opportunity to rekindle the positive moments I recorded in my journals and be grateful about it. I remember the science article I translated for an intern job that said “time seems to slow down when we’re exposed to new environments and experiences,” hence time seems to speed up in 2020 where we are not experiencing many novel things. Somehow I did not feel like time’s flying this year. I lived it moment by moment.
Moreover, I get how mindfulness can be overhyped, but I think I experience the benefit of being more mindful from journalling regularly. I am more resilient to face those hardships. Treating experiences and emotions as data points made me reframe my point of view to see each thing that happen to me as something to be learned. Each data point will build up useful insights to be utilized later to make life easier. I don’t dread negative experiences anymore, I just believe that I can somehow pass it like before and learn from it.
Oops, to be honest with you, actually some of these insights are not new. I already understood the ned to be accountable to myself since a couple of years ago, and so on.
Well, even if there are only few things that are to learn, it’s fun to do this. What’s the point if we can’t have fun? 🙂
If you become interested to apply reflection in your life, go for it. Start small with the free time that you have and forgive yourself when you miss it. Errors in early attempts are normal. What matters the most is that we keep going and develop the habit until it becomes the part of who you are.
Will I do similar thing in the next year? Most probably yes, but with some tweaks on the prompts so it’s more useful but takes less time and effort to fill. If you’re interested, you can follow this blog and be updated next year!
So get this daily journaling thing I sell on my shop! [insert link to online store]
Nah, jk. I am not selling things here, but that’s a common thing to put at the end of a long but useful article, right?
1in all seriousness, if you think you need a researcher and think that I am capable to do that, plus you have a predictable work situation, please let me know of the opportunity 🙂 Thanks!
Bonus! (since you read this until the end) >>>
Preview of the raw data from daily (left) and weekly (right) journalling:
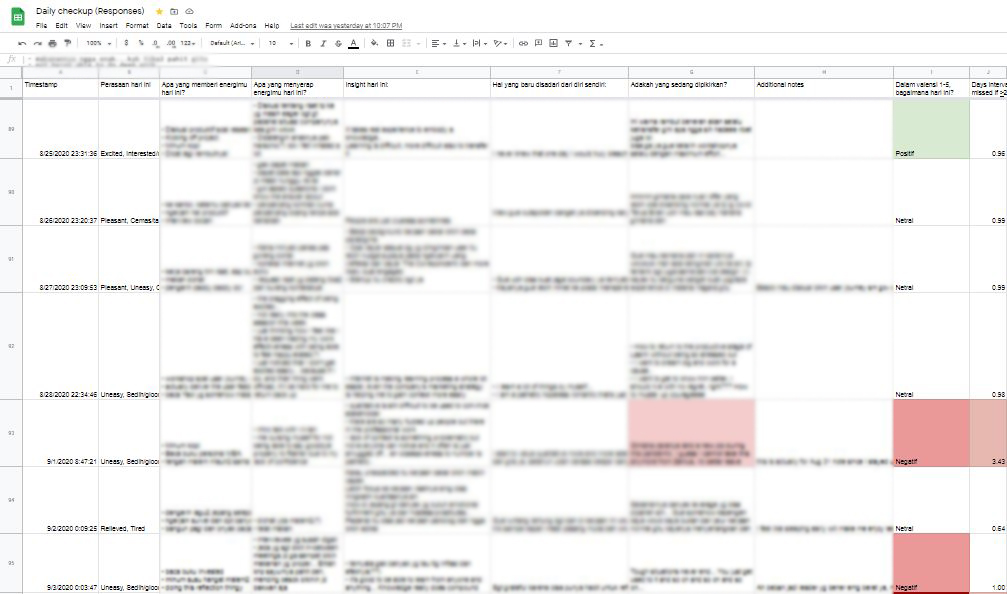
Daily journalling sneak peek 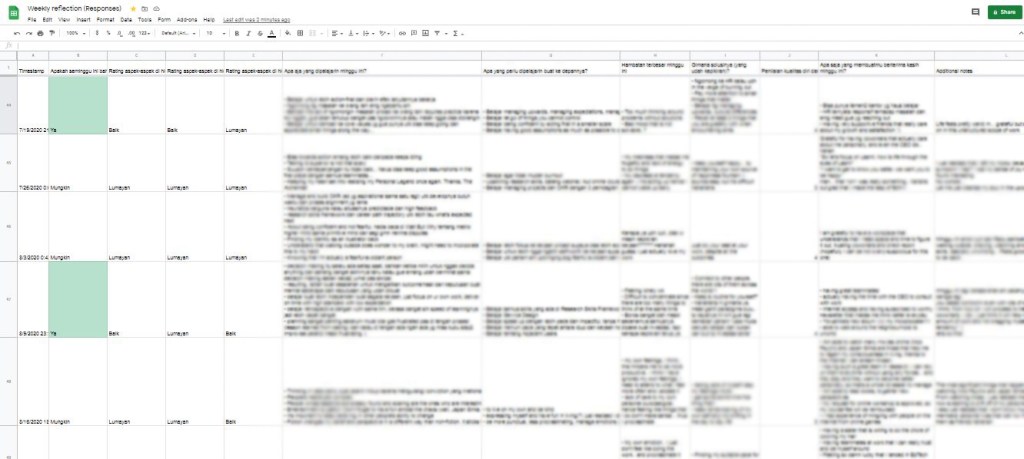
Weekly journalling sneak peek
Some data wrangling to make charts from:
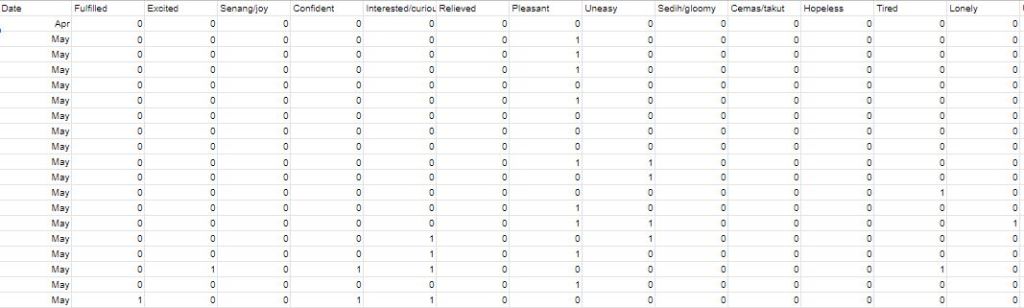
Converting text to 1 or 0 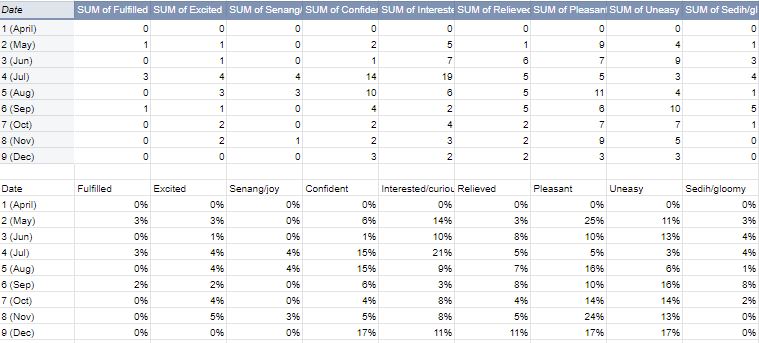
Using Pivot Table to count and sum to make % details as Sheets cannot make a chart data label as %, only in absolute number
Have you decided on a new year’s resolution? I found cool tweets about the stats of resolution effectiveness towards achieving happiness and how new year gives us a sense of fresh start:
I hope you have fun reading this as I am when writing! Cheers and Happy New Year 🙂

Leave a reply to 2021 End of Year Review with R – Lasmi's Thoughts Cancel reply